Archive for the ‘code’ Category

htop: cpu and memory usage stats

April 13th, 2021

htop is an enhancement over regular top and it's a very popular tool. But did you ever ask yourself how it actually works? In this article we'll be looking at where htop gets cpu and memory utilization information from. Given that htop runs on many different platforms, we'll be discussing just the Linux version of the story.

Cpu utilization per cpu

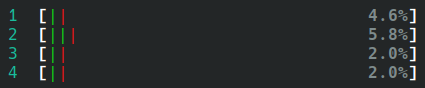
htop displays cpu utilization for each cpu. This is one the most key things we use htop for, in order to gauge the current load on the system.

The information comes from /proc/stat (documented here). This file contains a few different counters, but what's of interest to us right here are just the cpu lines which look like this:

cpu  5183484 9992 1575742 162186539 903310 0 27048 0 0 0
cpu0 1355329 2304 389040 40426679 299055 0 6431 0 0 0
cpu1 1234845 2602 423662 40594393 187209 0 16487 0 0 0
cpu2 1347723 2837 413561 40442958 239035 0 4085 0 0 0
cpu3 1245586 2246 349478 40722507 178009 0 44 0 0 0

So what are these numbers? Well, each number represents the amount of time spent in a particular state, by that cpu. This is true for each line that begins with cpuN. So cpu0 (which in htop is displayed as cpu #1) spent:

  1. 1355329 units of time in user mode (ie. running user processes)
  2. 2304 units of time in nice mode (ie. running user processes with a nice setting)
  3. 389040 units of time in system mode (ie. running kernel processes)
  4. 40426679 units of time in idle mode (ie. not doing anything)
  5. 299055 units of time in iowait (ie. waiting for io to become ready)
  6. 0 units of time servicing interrupts
  7. 6431 units of time servicing soft interrupts
  8. 0 units of time where the VM guest was waiting for the host CPU (if we're running in a VM)
  9. 0 units of time where we're running a VM guest
  10. 0 units of time where the VM guest is running with a nice setting

The first line in the file is simply an aggregate of all the per-cpu lines.

This is effectively the granularity that the kernel gives us about what the cpu spent time doing. The unit is something called USER_HZ, which is 100 on this system. So if we spent 1,355,329 units in user mode, that means 1355329 / 100 = 13,553 seconds (3.76 hours) spent running user processes since the system booted. By contrast, we spent 4.67 days in idle time, so this is clearly not a system under sustained load.

So how does htop use this? Each time it updates the ui it reads the contents of /proc/stat. Here are two subsequent readings one second apart, which show just the values for cpu0:

# time=0s
cpu0 1366294 2305 392684 40566185 300222 0 6590 0 0 0
# time=1s
cpu0 1366296 2305 392684 40566283 300222 0 6590 0 0 0

# compute the delta between the readings
cpu0 2 0 0 98 0 0 0 0 0 0

We can see that between the first and the second reading we spent 2 units in user mode and 98 units in idle mode. If we add up all of the numbers (2 + 98 = 100) we can see that the cpu spent 2 / 100 = 2% of its time running user processes, which means cpu utilization for cpu0 would be displayed as 2%.

Cpu utilization per process

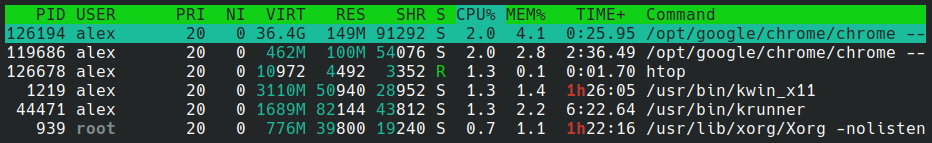
Cpu utilization per process is actually measured in a very similar way. This time the file being read is /proc/<pid>/stat (documented here) which contains a whole bunch of counters about the process in question. Here it is for the X server:

939 (Xorg) S 904 939 939 1025 939 4194560 233020 15663 1847 225 297398 280532 25 14 20 0 10 0 4719 789872640 10552 18446744073709551615 93843303677952 93843305320677 140727447720048 0 0 0 0 4096 1098933999 0 0 0 17 3 0 0 3235 0 0 93843305821872 93843305878768 93843309584384 140727447727751 140727447727899 140727447727899 140727447728101 0

Fields 14 and 15 are the ones we are looking for here, because they represent respectively:

  • utime, or the amount of time this process has been scheduled in user mode
  • stime, or the amount of time this process has been scheduled in kernel mode

These numbers are measured in the same unit we've seen before, namely USER_HZ. htop will thus calculate the cpu utilization per process as: ((utime + stime) - (utime_prev + stime_prev)) / USER_HZ.

htop will calculate this for every running process each time it updates.

Memory utilization on the system

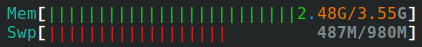
htop displays memory utilization in terms of physical memory and swap space.

This information is read from /proc/meminfo (documented here) which looks like this (here showing just the lines that htop cares about):

MemTotal:        3723752 kB
MemFree:          180308 kB
MemAvailable:     558240 kB
Buffers:           66816 kB
Cached:           782608 kB
SReclaimable:      87904 kB
SwapTotal:       1003516 kB
SwapCached:        13348 kB
SwapFree:         317256 kB
Shmem:            313436 kB

Unlike the cpu stats, these are not counters that accumulate over time, they are point in time snapshots. Calculating the current memory utilization comes down to MemTotal - MemFree. Likewise, calculating swap usage means SwapTotal - SwapFree - SwapCached.

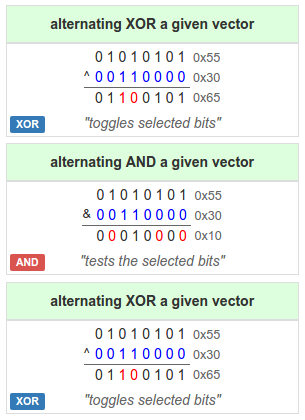
htop uses the other components of memory use (buffers, cached, shared mem) to color parts of the progress bar accordingly.

Memory utilization per process

Memory utilization per process is shown as four numbers:

  • virtual memory, ie. how much memory the process has allocated (but not necessarily used yet)
  • resident memory, ie. how much memory the process currently uses
  • shared memory, ie. how much of its resident memory is composed of shared libraries that other processes are using
  • memory utilization %, ie. how much of physical memory this process is using. This is based on the resident memory number.

This information is read from the file /proc/<pid>/statm (documented here). The file looks like this:

196790 9938 4488 402 0 28226 0

This is the X server process once again, and the numbers mean:

  1. virtual memory size
  2. resident memory size
  3. shared memory size
  4. size of the program code (binary code)
  5. unused
  6. size of the data + stack of the program
  7. unused

These numbers are in terms of the page size, which on this system is 4096. So to calculate the resident memory for Xorg htop does 9938 * 4096 = 38mb. To calculate the percentage of system memory this process uses htop does (9938 * 4096) / (3723752 * 1024) = 1.1% using the MemTotal number from before.

Conclusion

As we have seen in this practical example the kernel provides super useful information through a file based interface. These are not really files per se, because it's just in-memory state inside the kernel made available through the file system. So there is minimal overhead associated with opening/reading/closing these files. And this interface makes it very accessible to both sophisticated programs like htop as well as simple scripts to access, because there is no need to link against system libraries. Arguably, this API makes the information more discoverable because any user on the system can cat files on the /proc file system to see what they contain.

The downside is that these are files in text format which have to be parsed. If the format of the file changes over time the parsing logic may break, and a program like htop has to account for the fact that newer kernel versions may add additional fields. In Linux there is also an evolution in progress where the /proc file system remains, but more and more information is exposed through the /sys file system.

two weeks of rust

January 10th, 2016

Disclaimer: I'm digging Rust. I lost my hunger for programming from doing too many sad commercial projects. And now it's back. You rock, Rust!

I spent about two weeks over the Christmas/New Year break hacking on emcache, a memcached clone in Rust. Why a memcached clone? Because it's a simple protocol that I understand and is not too much work to implement. It turns out I was in for a really fun time.

UPSIDES

The build system and the package manager is one of the best parts of Rust. How often do you hear that about a language? In Python I try to avoid even having dependencies if I can, and only use the standard library. I don't want my users to have to deal with virtualenv and pip if they don't have to (especially if they're not pythonistas). In Rust you "cargo build". One step, all your dependencies are fetched, built, and your application with it. No special cases, no build scripts, no surprising behavior *whatsoever*. That's it. You "cargo test". And you "cargo build --release" which makes your program 2x faster (did I mention that llvm is pretty cool?)

Rust *feels* ergonomic. That's the best word I can think of. With every other statically compiled language I've ever used too much of my focus was being constantly diverted from what I was trying to accomplish to annoying little busy work the compiler kept bugging me about. For me Rust is the first statically typed language I enjoy using. Indeed, ergonomics is a feature in Rust - RFCs talk about it a lot. And that's important, since no matter how cool your ideas for language features are you want to make sure people can use them without having to jump through a lot of hoops.

Rust aims to be concise. Function is fn, public is pub, vector is vec, you can figure it out. You can never win a discussion about conciseness because something will always be too long for someone while being too short for someone else. Do you want u64 or do you want WholeNumberWithoutPlusOrMinusSignThatFitsIn64Bits? The point is Rust is concise and typeable, it doesn't require so much code that you need an IDE to help you type some of it.

Furthermore, it feels very composable. As in: the things you make seem to fit together well. That's a rare quality in languages, and almost never happens to me on a first project in a new language. The design of emcache is actually nicely decoupled, and it just got that way on the first try. All of the components are fully unit tested, even the transport that reads/writes bytes to/from a socket. All I had to do for that is implement a TestStream that implements the traits Read and Write (basically one method each) and swap it in for a TcpStream. How come? Because the components provided by the stdlib *do* compose that well.

But there is no object system! Well, structs and impls basically give you something close enough that you can do OO modeling anyway. It turns out you can even do a certain amount of dynamic dispatch with trait objects, but that's something I read up on after the fact. The one thing that is incredibly strict in Rust, though, is ownership, so when you design your objects (let's just call them them that, I don't know what else to call them) you need to decide right away whether an object that stores another object will own or borrow that object. If you borrow you need to use lifetimes and it gets a bit complicated.

Parallelism in emcache is achieved using threads and channels. Think one very fast storage and multiple slow transports. Channels are async, which is exactly what I want in this scenario. Like in Scala, when you send a value over a channel you don't actually "send" anything, it's one big shared memory space and you just transfer ownership of an immutable value in memory while invalidating the pointer on the "sending" side (which probably can be optimized away completely). In practice, channels require a little typedefing overhead so you can keep things clear, especially when you're sending channels over channels. Otherwise I tend to get lost in what goes where. (If you've done Erlang/OTP you know that whole dance of a tuple in a tuple in a tuple, like that Inception movie.) But this case stands out as atypical in a language where boilerplate is rarely needed.

Macros. I bet you expected these to be on the list. To be honest, I don't have strong feelings about Rust's macros. I don't think of them as a unit of design (Rust is not a lisp), that's what traits are for. Macros are more like an escape hatch for unpleasant situations. They are powerful and mostly nice, but they have some weird effects too in terms of module/crate visibility and how they make compiler error messages look (slightly more confusing I find).

The learning resources have become very good. The Rust book is very well written, but I found it a tough read at first. Start with Rust by example, it's great. Then do some hacking and come back to "the book", it makes total sense to me now.

No segfaults, no uninitialized memory, no coercion bugs, no data races, no null pointers, no header files, no makefiles, no autoconf, no cmake, no gdb. What if all the problems of c/c++ were fixed with one swing of a magic wand? The future is here, people.

Finally, Rust *feels* productive. In every statically compiled language I feel I would go way faster in Python. In Rust I'm not so sure. It's concise, it's typeable and it's composable. It doesn't force me to make irrelevant nit picky decisions that I will later have to spend tons of time refactoring to recover from. And productivity is a sure way to happiness.

DOWNSIDES

The standard library is rather small, and you will need to go elsewhere even for certain pretty simple things like random numbers or a buffered stream. The good news is that Rust's crates ecosystem has already grown quite large and there seem to be crates for many of these things, some even being incubated to join the standard library later on.

While trying to be concise, Rust is still a bit wordy and syntax heavy with all the pointer types and explicit casts that you see in typical code. So it's not *that easy* to read, but I feel once you grasp the concepts it does begin to feel very logical. I sure wouldn't mind my tests looking a bit simpler - maybe it's just my lack of Rust foo still.

The borrow checker is tough, everyone's saying this. I keep running into cases where I need to load a value, do a check on it, and then make a decision to modify or not. Problem is the load requires a borrow, and then another borrow is used in the check, which is enough to break the rules. So far I haven't come across a case I absolutely couldn't work around with scopes and shuffling code around, but I wouldn't call it fun - nor is the resulting code very nice.

Closures are difficult. In your run-of-the-mill language I would say "put these lines in a closure, I'll run them later and don't worry your pretty little head about it". Not so in Rust because of move semantics and borrowing. I was trying to solve this problem: how do I wrap (in a minimally intrusive way) an arbitrary set of statements so that I can time their execution (in Python this would be a context manager)? This would be code that might mutate self, refers to local vars (which could be used again after the closure), returns a value and so on. It appears tricky to solve in the general case, still haven't cracked it.

*mut T is tricky. I was trying to build my own LRU map (before I knew there was a crate for it), and given Rust's lifetime rules you can't do circular references in normal safe Rust. One thing *has to* outlive another in Rust's lifetime model. So I started hacking together a linked list using *mut T (as you would) and I realized things weren't pointing to where I thought they were at all. I still don't know what happened.

The builder pattern. This is an ugly corner of Rust. Yeah, I get that things like varargs and keyword arguments have a runtime overhead. But the builder pattern, which is to say writing a completely separate struct just for the sake of constructing another struct, is pure boilerplate, it's so un-Rust. Maybe we can derive these someday?

Code coverage. There will probably be a native solution for this at some point. For now people use a workaround with kcov, which just didn't work at all on my code. Maybe it's because I'm on nightly? Fixed!

---

So there you have it. Rust is a fun language to use, and it feels like an incredibly well designed language. Language design is really hard, and sometimes you succeed.

a little help with bitwise operators

August 3rd, 2015

Binary numbers are easy, right? You just do stuff with bits.

But invariably whenever I code C I can never remember how to actually set a bit or test a bit, I keep getting and and or confused.

So I made a cheat sheet I can look up any time. These are the key ones:

All the others are available on the cheat sheet.

so do you know how your program executes?

August 2nd, 2015

The answer is no, and here's why you shouldn't feel peer pressured into saying yes.

I was reading about disassembly recently when I came across this nugget:

(...) how can a disassembler tell code from data?

The problem wouldn't be as difficult if data were limited to the .data section of an executable and if executable code were limited to the .code section of an executable, but this is often not the case. (...) A technique that is often used is to identify the entry point of an executable, and find all code reachable from there, recursively. This is known as "code crawling".

(...)

The general problem of separating code from data in arbitrary executable programs is equivalent to the halting problem.

Well, if we can't even do *that*, what can we do?

We start with a program you wrote, awesome. We know that part. We compile it. Your favorite language constructs get desugared into very ordinary looking code - all the art you put into your program is lost! Abstract syntax tree, data flow analysis, your constants are folded and propagated, your functions are inlined. By now you wouldn't even know that it's the same program, and we're still in "high level language" territory (probably some intermediate language in the compiler). Now we get basic blocks and we're gonna lay them out in a specific order. This is where the compiler tries to play nice with the branch prediction in your cpu. Your complicated program aka "my ode to control flow" now looks very flat - because it's assembly code. And at last we assemble into machine code - the last vestiges of intelligent life (function names, variable names, any kind of symbolic information) are lost and become just naked memory addresses.

Between your program and that machine code... so many levels. And at each level there are ways to optimize the code. And all of those optimizations have just happened while you stared out the window just now.

So I started thinking about how programs execute. The fact is that predicting the exact execution sequence of a program, even in C, even in C 101 (no pointers, no threading) is basically impossible. Okay, I'm sure it's possible, but I'd have to know the details of my exact cpu model to have a chance.

I need to know how big the pre-fetch cache is. I bet there are some constants that control exactly how the out of order execution engine works - I need to know those. And I need to know the algorithms that are used there (like branch prediction, remember?). I need to know... oh shoot, multicore! Haha, multicore is a huge problem.

Basically, I need to know exactly what else is running on my system at this very time, because that's gonna wreak havoc with my caches. If my L1 gets hosed by another process that's gonna influence a load from memory that I was just about do. Which means I can't execute this instruction I was going to. So I have to pick some other instructions I have lying around and execute those speculatively while we wait for that delivery truck to return all the way from main memory.

Speculatively, you say? Haha yes, since we have these instructions here we'll just go ahead and execute them in case it turns out we needed to do that. Granted, a lot of what a cpu does is stuff like adding numbers, which is pretty easy to undo. "Oops, I 'accidentally' overwrote eax." I guess that addition never happened after all.

And then hyper threading! Do you know how hyper threading works? It's basically a way of saying "this main memory is so damn slow that I can simulate the execution of *two* different programs on a single core and noone's really gonna notice".

This whole thing gives rise to a philosophical question: what is the truth about your program? Is it the effect you observe based on what you read from memory and what you see in the registers (ie. the public API of the cpu)? Or is it the actual *physical* execution sequence of your instructions (the "implementation details" you don't see)?

I remember when virtual machines were starting to get popular around 2000 and there was a lot of discussion about whether they were a good thing - "think about the performance implications". Hell, our so-called physical machines have been virtual for a very long time already!

It's just that the cpu abstraction doesn't seem to leak very much, so you think your instructions are being executed in order. Until you try to use threads. And then you have to ask yourself the deep existential question: what is the memory model of my machine anyway? Just before you start putting memory barriers everywhere.

So no, you don't. But none of your friends do either (unless they work for Intel).

do you know c?

November 13th, 2014

In discussions on programming languages I often see C being designated as a neat, successful language that makes the right tradeoffs. People will go so far as to say that it's a "small language", it "fits in your head" and so on.

I can only imagine that people saying these things have forgotten how much effort it was to really learn C.

I've seen newbies ask things like "I'm a java coder, what book should I use to learn C?" And a lot people will answer K&R. Which is a strange answer, because K&R is a small book (to further perpetuate this idea that it's a small language), is not exactly pedagogical, and still left me totally confused about C syntax.

In practice, learning C takes so much more than that. If you know C the language then you really don't know anything yet.

Because soon enough you discover that you also need to know the preprocessor and macros, gcc, the linker, the loader, make and autoconf, libc (at least what is available and what is where - because it's not organized terribly well), shared libraries and stuff like that. Fair enough, you don't need it for Hello World, but if you're going to do systems programming then it will come up.

For troubleshooting you also need gdb and basically fundamental knowledge of your machine architecture and its assembly language. You need to know about memory segments and the memory layout and alignment of your datastructures and how compiler optimizations affect that. You will often use strace to discover how the program actually behaves (and so you have to know system calls too).

Much later, once you've mastered all that, you might chance upon a slide deck like Deep C whose message basically is that you don't understand anything yet. What's more terrifying is that the fundamental implication at play is: don't trust the abstractions in the language, because when things break you will need to know how it works under the hood.

In a high level language, given effort, it's possible to design an API that is easy to use and hard to misuse and where doing it wrong stands out. Not so in C where any code is always one innocuous looking edit away from a segfault or a catastrophic security hole.

So to know C you need all of that. But that's mostly the happy path. Now it's time to learn about everything that results in undefined behavior. Which is the 90% of the iceberg below the surface. Whenever I read articles about undefined behavior I'm waiting for someone to pinch me and say the language doesn't actually allow that code. Why would "a = a++;" not be a syntax error? Why would "a[i]" and "i[a]" be treated as the same when syntactically they so clearly aren't?

Small language? Fits in your head? I don't think so.

Oh, and once you know C and you want to be a systems programmer you also need to know Posix. Posix threads, signals, pipes, shared memory, sync/async io, ... well you get the idea.